Comparison of Korean Speech De-identification Performance of Speech De-identification Model and Broadcast Voice Modulation
From July 2022 to March 2023, I worked on a commissioned study of speech anonymization. We wanted to know how much protection the pitch shifting used in television interviews actually provides, and whether lightweight anonymization methods could do better on Korean call-center speech.
The recordings had to remain useful after processing. Listeners needed to understand the conversation, while both people and speaker-verification models should find it harder to identify the speaker. The work led to a KCI-indexed paper in 2023.
01 · Research question
How much does pitch shifting hide a speaker?
News programs often raise or lower a source's voice pitch to conceal their identity. This is easy to implement, but estimating and reversing the shift can recover speech close to the original. Speaker identity also depends on formants, vocal-tract length, resonance, and speaking habits. Changing the fundamental frequency alone leaves many of these cues intact.
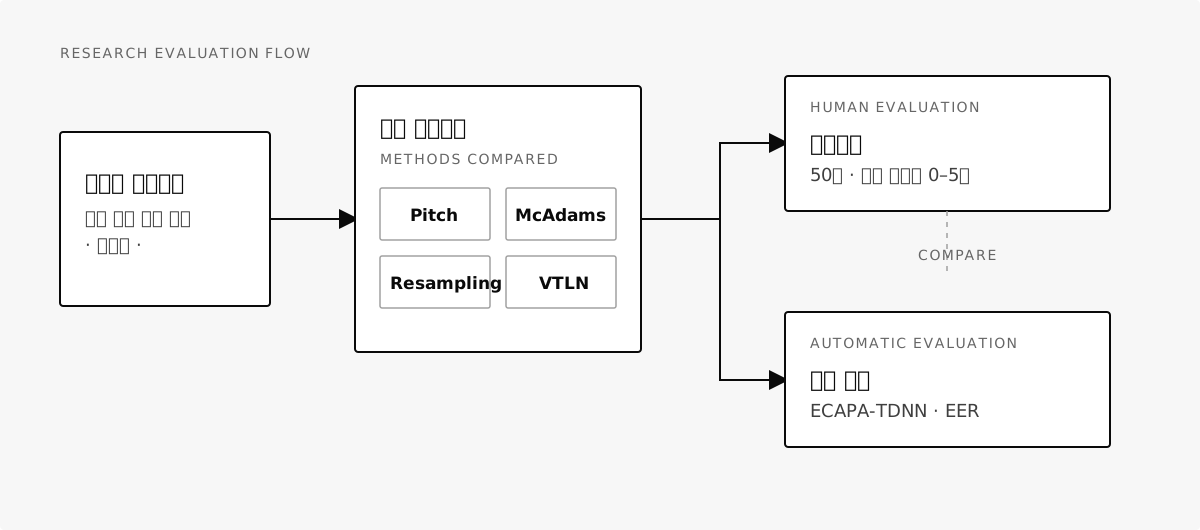
We used broadcast-style pitch shifting as a baseline and compared it with McAdams, Resampling, and VTLN from the VoicePrivacy family of lightweight methods. All four processed the same Korean recordings. We measured perceived speaker similarity, errors made by a speaker-verification model, and how well the words survived each transformation.
Privacy and intelligibility
A useful method needs to obscure speaker identity while preserving the words. A high verification error rate was not enough if the processed speech was difficult to understand.
02 · Method screening
Choosing methods before processing the call corpus
We first screened the available lightweight methods on Korean speech from AI Hub. The source corpus contained 3,000 speakers and 7,000 hours of audio. We selected 100 speakers and 30 utterances per speaker, giving us 3,000 utterances for this stage.
For each method, we extracted speaker embeddings with ECAPA-TDNN and calculated the equal error rate (EER). We also listened to the processed audio. Modspec produced a high EER, but the speech sounded heavily distorted and was difficult to use. We kept McAdams, Resampling, and VTLN for the main comparison.
Why listening mattered at this stage
Selecting by EER alone could have favored Modspec. Listening to the samples helped us exclude methods whose apparent privacy gains came with too much damage to the speech.
03 · Source corpus
97,285 Korean call-center recordings
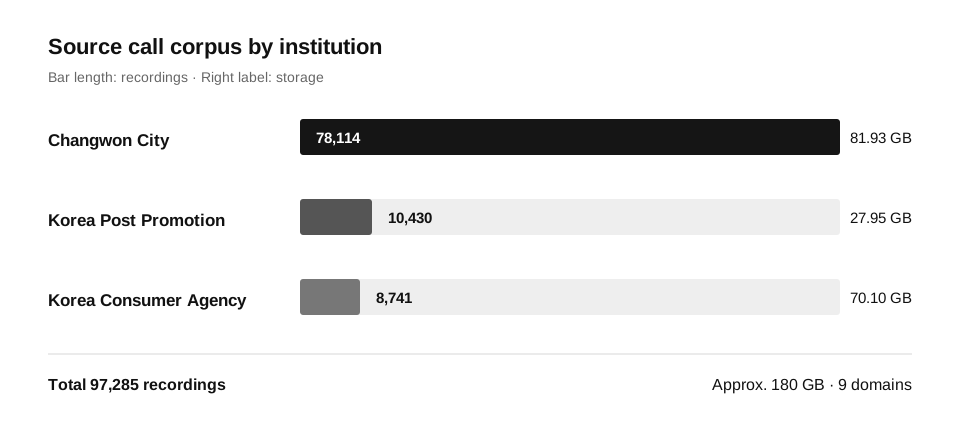
The main corpus was managed by Timegate and contained conversations between agents and callers. The recordings came from Changwon City, the Korea Postal Service Agency, and the Korea Consumer Agency. In total, the corpus held 97,285 recordings and approximately 180 GB of audio.
| Source | Recordings | Size | Domains |
|---|---|---|---|
| Changwon City | 78,114 | 81.93 GB | Culture and tourism; health and welfare; urban services and transport |
| Korea Postal Service Agency | 10,430 | 27.95 GB | E-commerce; postal services |
| Korea Consumer Agency | 8,741 | 70.10 GB | Transport and vehicles; finance; insurance; lifestyle and fashion |
| Total | 97,285 | Approximately 180 GB | 9 domains |
The original recordings were PCM audio at 8 kHz and 128 Kbps. We saved the processed files at 16 kHz and 256 Kbps for listening tests and automatic evaluation. The source recordings, transcripts, and identifying information are not published here because they contain real conversations and speaker information.
Extracting single-speaker segments from JSON labels
Each call contained speech from both an agent and a caller. We used the speaker IDs and utterance start and end times in the JSON labels to separate them. Filenames retained the domain, speaker role, and conversation ID so that each sample could be traced through processing and evaluation.
For the listening test, we selected segments that met these conditions:
- Clearly audible speech lasting 2–6 seconds.
- No overlap between speakers.
- No excessive background noise or strong dialect effects.
- A suitable comparison sample within the same gender and call domain.
This produced a set of utterances from 142 speakers. The listening test used 3,000 audio presentations, including repetitions. After removing duplicates, the automatic evaluation used 1,677 utterances: 837 from male speakers and 840 from female speakers.
04 · Anonymization methods
Four methods, with parameters chosen for Korean speech
We implemented broadcast-style Pitch shifting as the baseline. For the other methods, we varied the parameters in steps of 0.05 within the ranges given in the lightweight-model paper. We chose the final settings by listening for both the strength of the transformation and the intelligibility of the sentences, rather than simply using defaults chosen for English speech.
| Method | Main cue changed | Setting | Original–processed similarity |
|---|---|---|---|
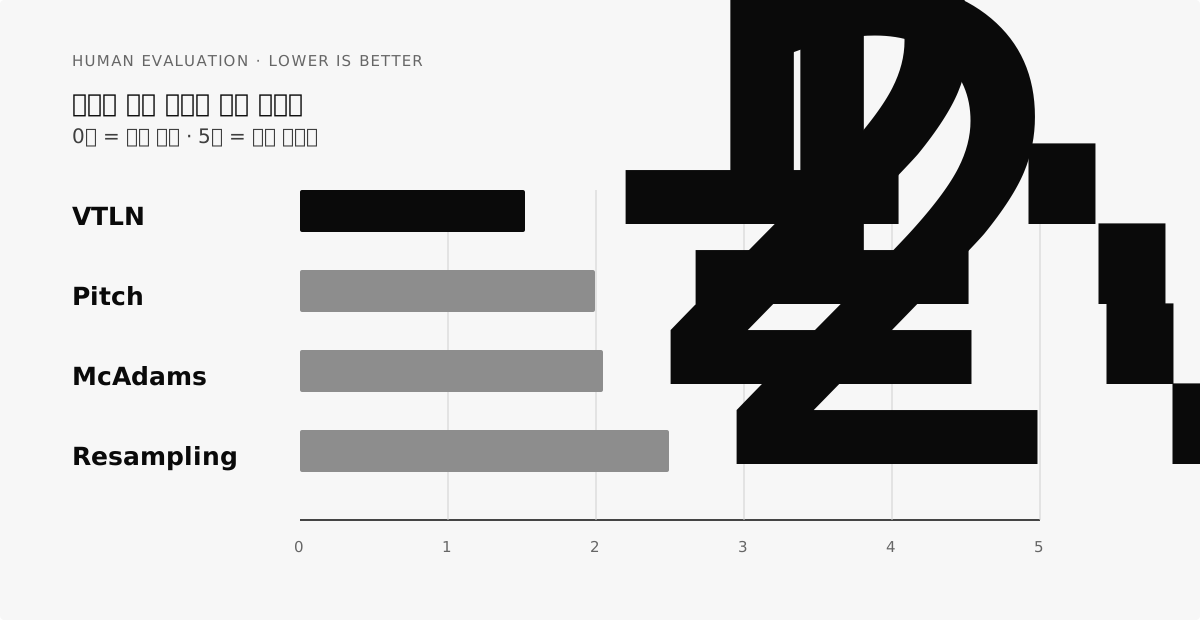
| Pitch | Fundamental frequency | Broadcast-style baseline | 1.99 |
| McAdams | Formants and resonance frequencies | Coefficient 0.80 | 2.05 |
| Resampling | Sampling characteristics | Rate 0.85 | 2.49 |
| VTLN | Frequency axis and vocal-tract characteristics | Factor 0.175 | 1.52 |
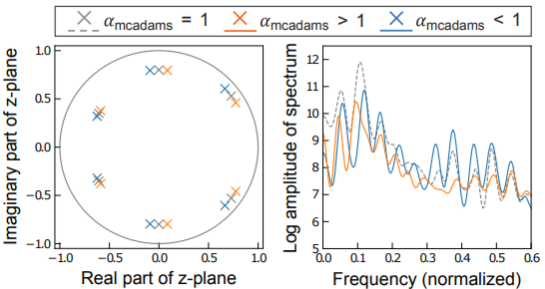
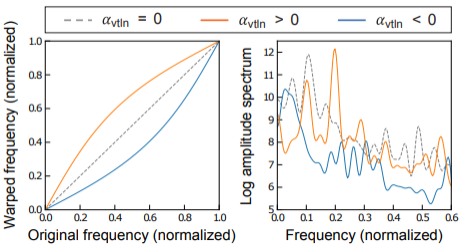
The McAdams transformation adjusts the angles of poles obtained through linear predictive coding, shifting formant-related resonance frequencies. VTLN warps the frequency axis to alter cues associated with vocal-tract length. Resampling changes sampling characteristics while preserving duration. These transformations affect a broader set of speaker cues than a shift in fundamental frequency alone.
05 · Evaluation protocol
Listening, speaker verification, and transcription
Blind listening test
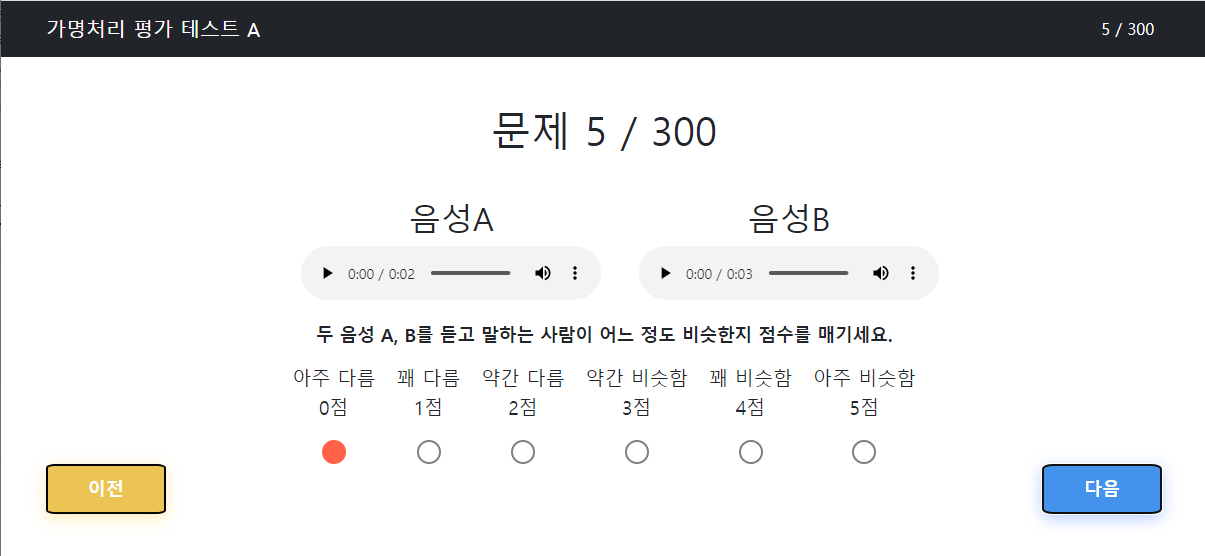
We recruited 50 participants, with ten in each age group from their teens through their fifties. After hearing two samples, each participant rated how likely they sounded to come from the same speaker. The scale ran from 0, “very different,” to 5, “very similar.”
The test contained 1,500 questions, divided into 5 sets of 300. Pairs included different utterances from the same speaker, utterances from different speakers, and an original utterance paired with its processed version. We matched gender and domain within each pair. Participants were asked to focus on voice characteristics rather than the words and to use the full rating scale. They spent at least 20 seconds on each question.
Speaker verification with ECAPA-TDNN
For automatic evaluation, we extracted speaker embeddings with ECAPA-TDNN and calculated cosine similarity. We swept the decision threshold and found the EER: the point at which the false acceptance rate equals the false rejection rate.
A lower EER normally means better speaker verification. Here, a higher EER after processing meant that the verifier found it harder to identify the original speaker. A value close to 50% indicated performance near random guessing between the two classes.
What each measure captures
- Perceived similarity — whether listeners still hear the original speaker.
- EER — how often the speaker verifier confuses identities.
- CER — how well the spoken words survive processing.
06 · Results
VTLN changed perceived identity most; Resampling confused the verifier most
Lowest of the four methods
Highest among the compared methods
Male 837 · Female 840
1,500 questions in total
In the project report, different utterances from the same speaker received a mean similarity score of 4.40, compared with 2.72 for different speakers. The published paper reported these as 4.41 and 2.73 because of rounding differences. These control pairs established that listeners could distinguish speaker identity before processing.
All four methods reduced original–processed similarity to between 1.52 and 2.49. VTLN had the lowest score in the report, at 1.52, below even the 2.72 score for unprocessed speech from different speakers. The paper's aggregation gave VTLN scores of 1.53 for same-speaker comparisons and 1.26 for different-speaker comparisons.
VTLN scores ranged from 1.27 for lifestyle and fashion calls to 1.59 for postal calls. The scores were 1.42 for male speakers and 1.62 for female speakers. The effect varied across domains and genders, but remained present in each group. Listener age also mattered: participants in their twenties gave a mean score of 0.93, compared with 1.89 for those in their fifties.
The automatic evaluation ranked the methods differently. EER was 14.88% on unprocessed speech, 43.68% after Pitch shifting, 44.00% after VTLN, and 46.39% after Resampling. VTLN changed perceived identity most, while Resampling made the verifier's job hardest.
The two rankings differed
Listeners and the verifier did not agree on the strongest method. Evaluating both was necessary to understand what kind of identity information each transformation removed.
07 · Utility and limits
Could listeners still understand the words?
We measured word preservation using character error rate (CER). First, we transcribed the original and processed recordings with CLOVA Speech Recognition. CER was high even on the originals, suggesting a mismatch between the recognizer and the 8 kHz call-center audio. This made it difficult to attribute transcription errors to anonymization alone.
We added a human transcription test to check intelligibility directly. Comparing those transcripts with the reference text gave CER below 20% for every method. People could still understand the speech reasonably well, despite the problems with automatic transcription.
Limits of the utility evaluation
CLOVA Speech Recognition produced high CER on unprocessed audio, so it was a weak basis for comparing the methods. Human transcription supplied additional evidence, but a recognizer suited to Korean telephone speech and a controlled comprehension test would give a more complete assessment.
08 · Conclusion
What this comparison established
Pitch shifting is easy to deploy, but reversing the shift can bring the voice back toward the original. On the Korean call corpus, VTLN and Resampling provided stronger anonymization than the Pitch baseline under the listening and verification measures, respectively.
There was no single winner across the evaluations. VTLN reduced perceived similarity most, and Resampling produced the highest EER. Human transcription supported the usability of the processed speech, while the automatic transcription results remained limited by the recording conditions. A useful next experiment would apply voice-restoration attacks and measure speaker similarity before and after restoration.
09 · Publication
Paper
Publication · First author
Comparison of Korean Speech De-identification Performance of Speech De-identification Model and Broadcast Voice Modulation